McKinsey research into mid-mile and last-mile handovers found that waste created at blind handoffs between shippers, dispatchers, third-party logistics providers, and carriers accounts for between 6% and 13% of carrier revenue, with dwell time identified as a primary driver.
A hub and spoke network is built entirely from handoffs. That is the model’s mechanism and its exposure. What follows is the six controls that determine whether a hub network performs, the measures that reveal each one, and how to tell a genuine capacity problem from a sequencing problem.
What hub and spoke distribution is
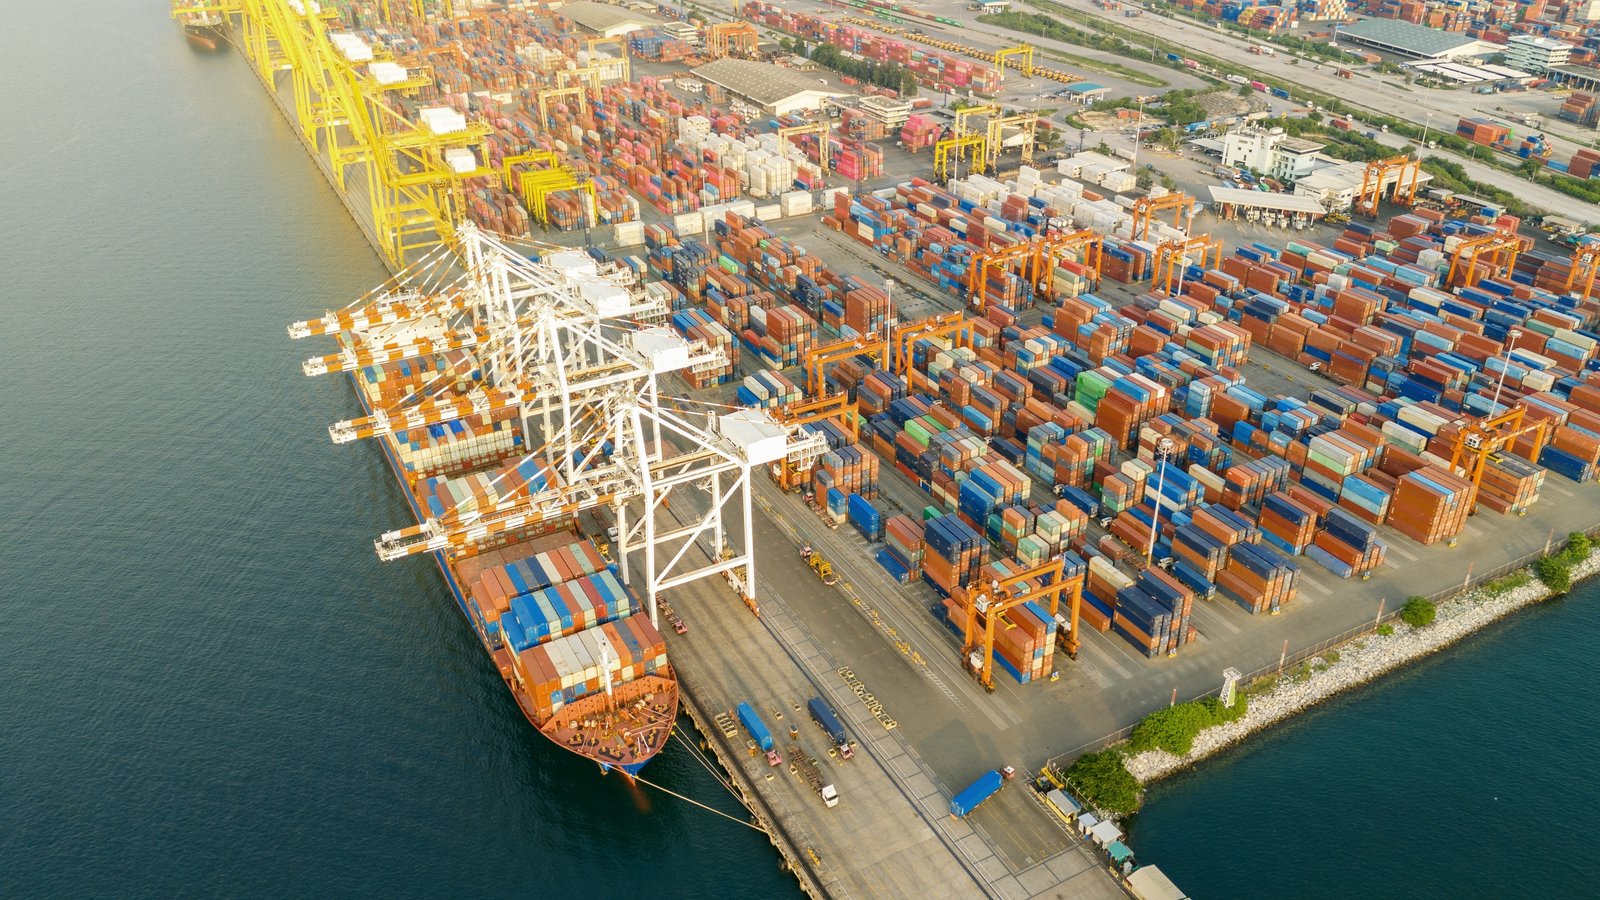
Hub and spoke distribution routes volume through a central facility, where inbound freight is sorted and consolidated before being dispatched to outlying destinations, rather than moving directly between origin and destination.
The hub sorts and consolidates. The spokes handle regional and final delivery. Routes are structured around the centre rather than around individual pairs of points.
What the model is actually buying
The model trades distance for density. Every consignment travels further than the direct route in exchange for travelling in a fuller vehicle.
MIXMOVE frames the consequence plainly, because it determines where management attention should go. The detour is a fixed cost incurred immediately. The density is a benefit that only materialises if the consolidation actually happens at the hub. When it does not, the network has paid for the distance and received nothing in return.
Why management attention sits in the wrong place
Hub performance is usually managed as throughput. Units processed, vehicles turned, hours worked. Those measures describe activity inside the building.
The cost sits in the transfer, not the activity. A unit arriving, waiting for a routing decision, and departing on a half-empty vehicle has been processed successfully by every measure in use and has generated exactly the waste McKinsey describes.
The systems reinforce this. Warehouse management systems govern stored inventory and treat flow-through freight as an exception. Transport management systems plan movement between locations and do not see what physically arrived. Neither owns the moment an inbound unit becomes an outbound commitment, which is the moment that determines whether consolidation happens.
The six controls that decide performance
Inbound predictability. Whether the hub knows what is arriving before it arrives. Every other control depends on this one, because sortation cannot be planned against unknown contents.
Sortation decision speed. The interval between a unit arriving and its onward allocation being known. This interval is where dwell accumulates and where consolidation opportunities expire.
Consolidation discipline. Whether outbound loads are built to fill or built to schedule. A vehicle departing at a fixed hour has made a consolidation decision that nobody evaluated.
Instruction delivery at the point of work. Whether the sortation decision reaches the dock team while the freight is still on the dock. A correct decision that arrives late has the same effect as a wrong one.
Spoke capacity awareness. Whether the hub knows what each destination can receive. Consolidating upstream into a site that cannot absorb the load moves congestion rather than removing it.
Exception recovery time. How quickly a load can be rebuilt when conditions change. Networks that cannot revise a decision inside the window must plan conservatively, which costs fill rate every day.
The five KPIs that reveal each control
Dock-to-stock time. How quickly inbound freight becomes available for onward allocation. The earliest indicator that inbound predictability or decision speed has degraded.
Fill rate by leg. Utilisation per movement rather than averaged across the network. Averages conceal the legs where the loss concentrates.
Dwell time per vehicle, per site. The most revealing measure available and usually the least reported. It converts congestion into a number with an owner.
Error rate in sorting and routing. Mis-sorted units indicate that instructions are not reaching the point of work in usable form.
Order cycle time. End to end, from receipt of the order to delivery. The measure that captures whether the other five are working together.
How to tell a capacity problem from a sequence problem
This diagnostic is worth running before any capital is committed, because the two problems look identical from the outside and cost very differently to solve.
A capacity problem shows constant congestion, dock-to-stock time that rises in proportion to volume, and utilisation that stays high across all legs.
A sequence problem shows congestion that varies with the arrival pattern rather than the volume, dock-to-stock time that spikes irregularly, and fill rates that stay poor even on quiet days. A quiet day with half-empty outbound vehicles is conclusive. That network is not short of space.
Recorded throughput gains of up to 130% in hub operations indicate how much capacity typically sits inside existing buildings once sequencing improves.
What the evidence shows
McKinsey attributes between 6% and 13% of carrier revenue to waste at handover points, with dwell time named as a leading driver.
Deloitte reports that 66% of retail executives surveyed plan to restructure their supply chains if input costs rise, with 30% using AI for supply chain visibility rising to an expected 41% within a year.
Across MIXMOVE deployments, hub operations have recorded up to 130% higher warehouse hub throughput, up to 80% fewer errors, up to 50% less warehouse space, and up to 58% labour cost savings. Dwell time reductions of 40%, fill rate improvements of 10% to 20%, and up to 15% more billable output have been recorded. The platform is in use across 35+ distribution companies in 20+ countries.
At 3M, a decade of collaboration produced a 90% truck fill rate, a 35% reduction in transport costs, and a 50% reduction in CO₂ emissions.
“By using the MIXMOVE software, 3M managed to reduce transport costs by 35% and CO₂ emissions by 50%.”
— Patrick Van De Vyver, Former Head of EMEA Logistics Operations, 3M
How MIXMOVE HUB OS governs the transfer
MIXMOVE HUB OS addresses the transfer rather than the activity around it. Inbound freight is identified at item level on arrival and matched against live outbound commitments before unloading decisions are made, which collapses the sortation interval where dwell and lost consolidation accumulate.
Outbound loads are built against live spoke capacity rather than a fixed timetable, so consolidation is a decision rather than a consequence of the schedule.
Sortation instructions surface at the point of work, and a load can be rebuilt inside the operating window when conditions change.
MIXMOVE HUB OS operates alongside an existing TMS, WMS, or ERP as an orchestration layer, or as a standalone platform where no system currently governs the hub.
MIXMOVE DI reports the six controls from execution data, including dwell by site and fill rate by leg, alongside Scope 3 transport reporting built to ISO 14083 methodology.
The hub is where the model earns its detour back. Throughput measures activity, not consolidation. Networks that govern the transfer stop paying for distance they never recovered.
Read the MIXMOVE HUB OS overview to see how sortation decisions are made before the trailer doors open.
Frequently asked questions
What is hub and spoke distribution?
A distribution model that routes volume through a central facility for sorting and consolidation before dispatch to outlying destinations, rather than moving directly between each origin and destination pair.
What is the main failure point in a hub and spoke network?
The transfer inside the hub, where an inbound unit becomes an outbound commitment. Consolidation opportunities expire during this interval, and no system in most stacks owns it.
Which KPIs matter most for hub and spoke distribution?
Dock-to-stock time, fill rate measured per leg rather than averaged, dwell time per vehicle per site, sorting and routing error rate, and end-to-end order cycle time.
How do I know whether my hub needs more space?
Check fill rates on quiet days. A network with congestion but half-empty outbound vehicles on low-volume days has a sequencing problem rather than a capacity problem, and additional space will not resolve it.